The European Defence Agency (EDA) today published the aggregated defence data for 2013 of the 27 EDA participating Member States.
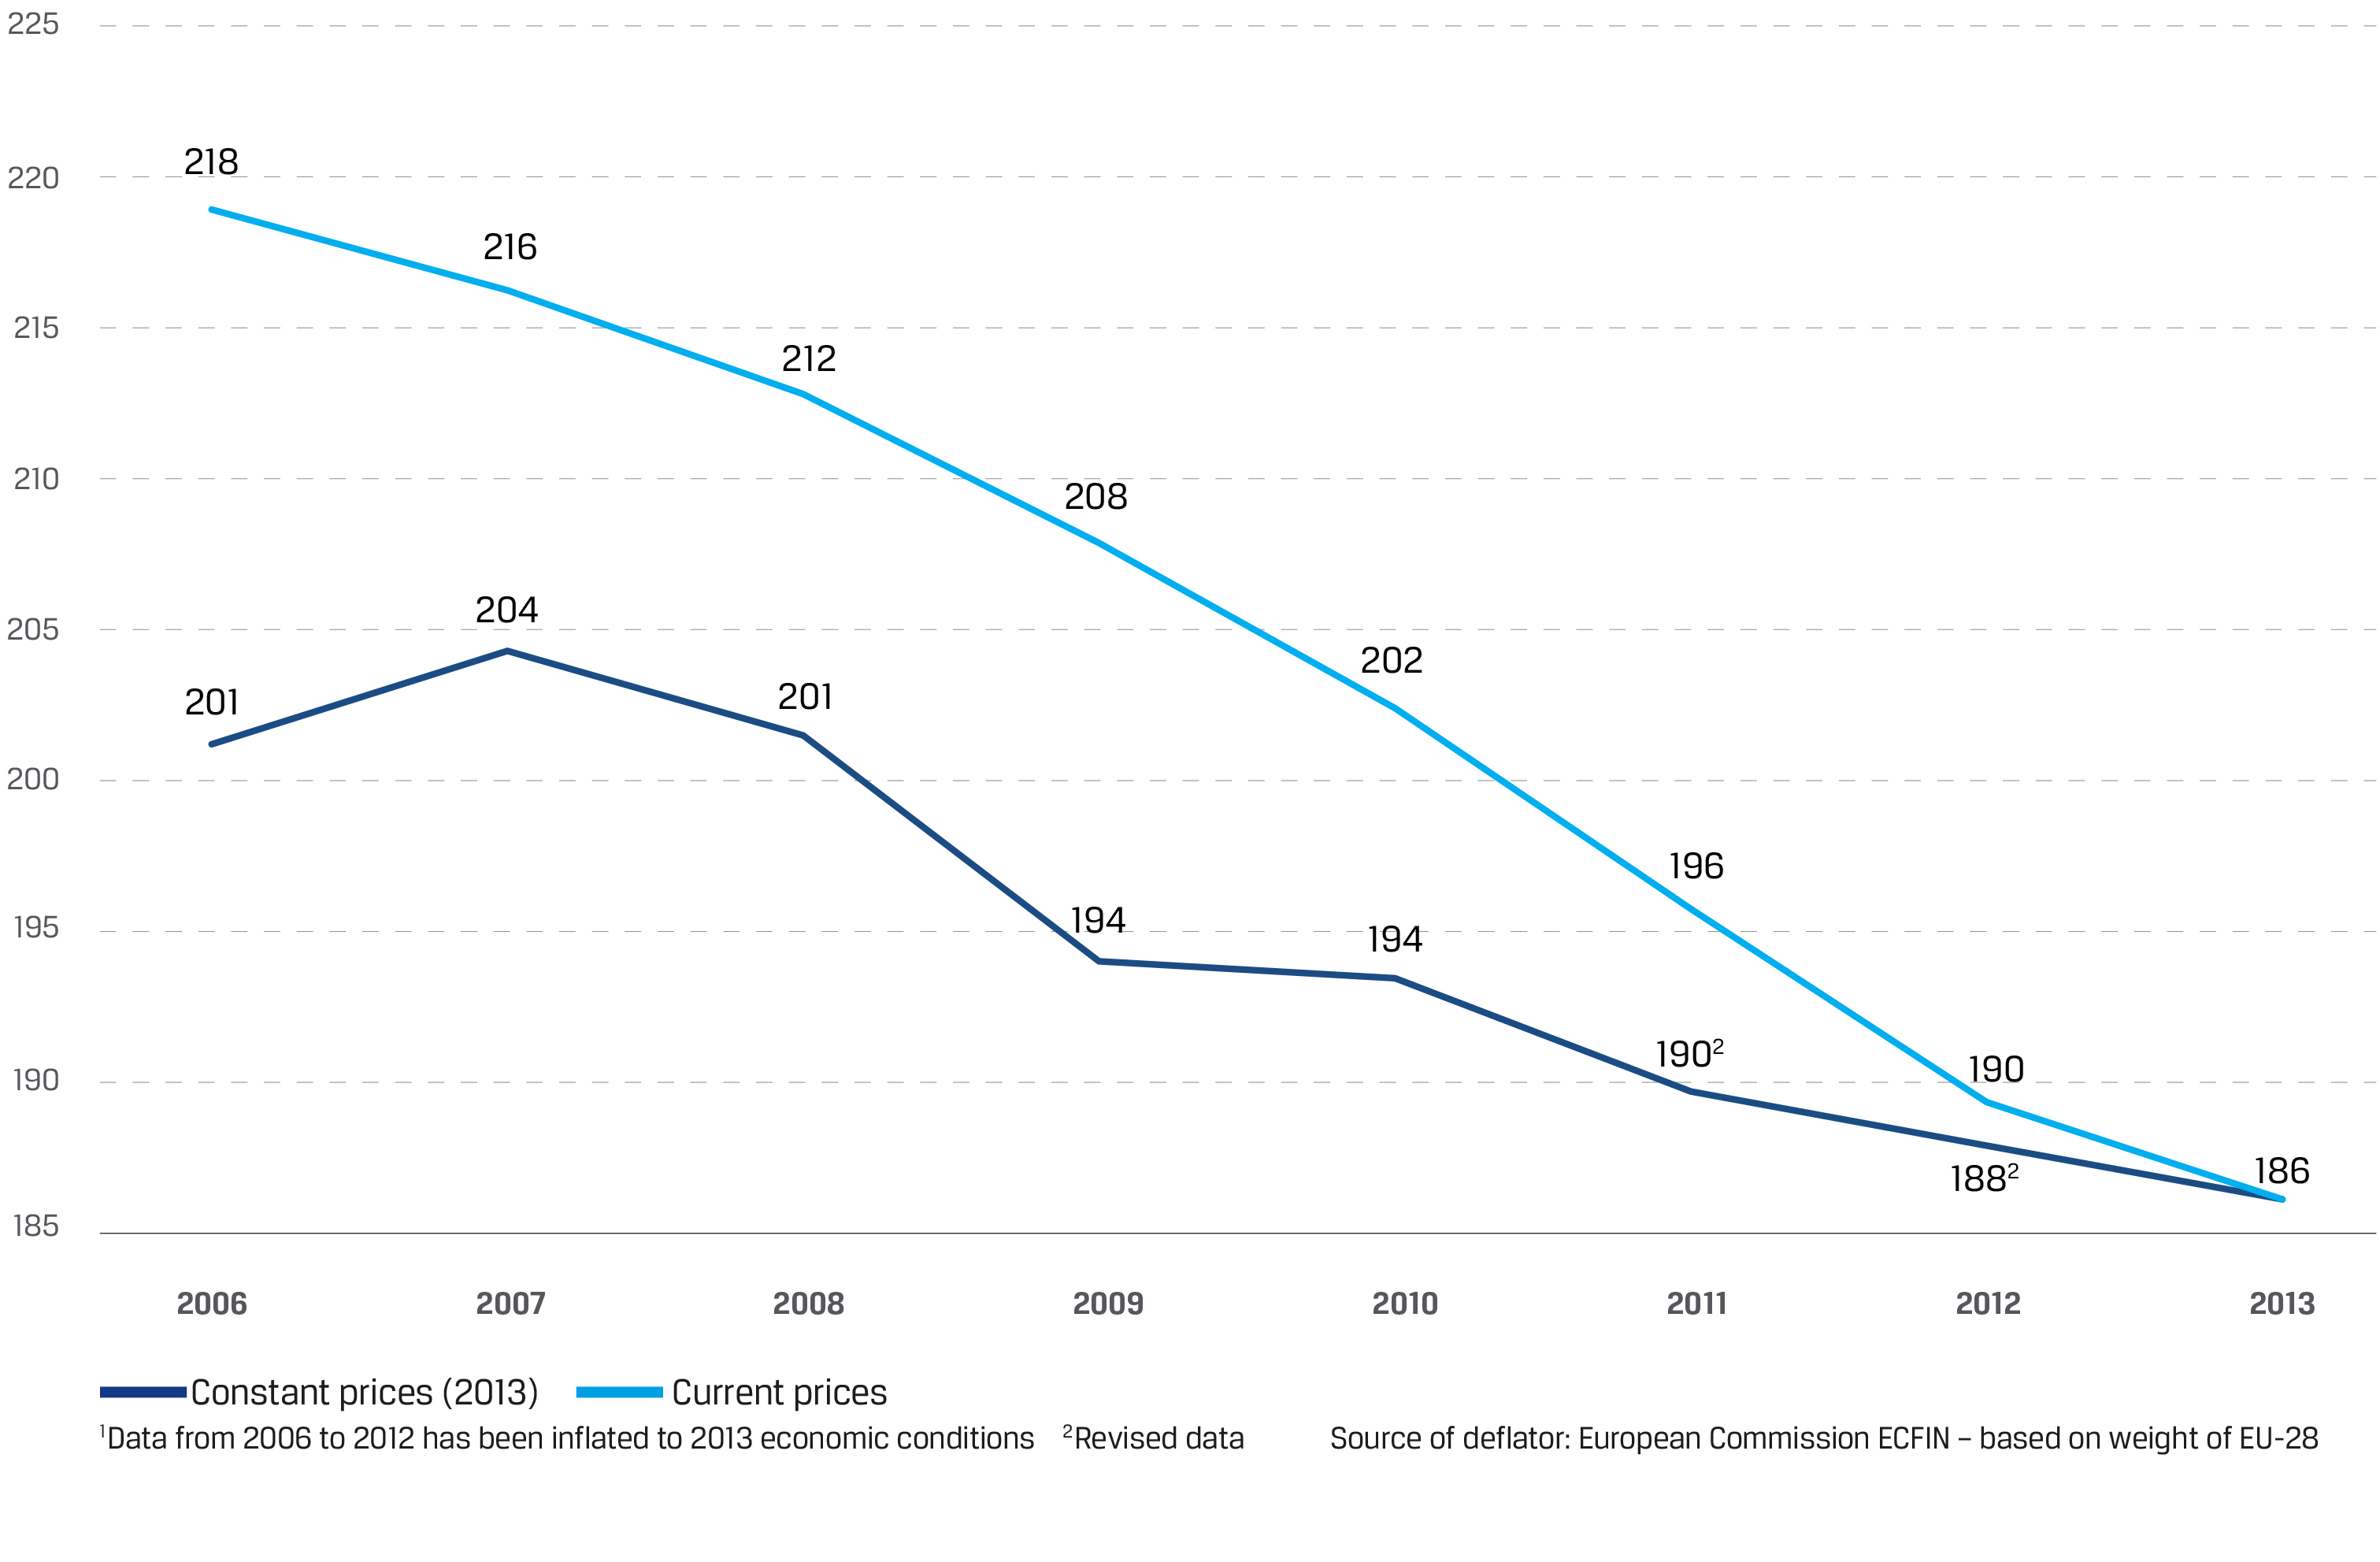
2013 was no exception to the recent years’ trend across EDA Member States to cut defence spending. Despite the fact that EDA increased from 26 to 271 Member States in 2013, the total defence expenditure of its Member States decreased by EUR 1.7 billion or 0.9%, compared to 2012, to EUR 186 billion. In real terms², the total defence expenditure has been declining since 2006, dropping by over EUR 32 billion or about 15% from 2006 to 2013.
Both as a share of GDP and as a share of the total government spending, defence expenditure has decreased for the seventh year in a row to its lowest value since 2006, 1.45% and 2.97%, respectively.
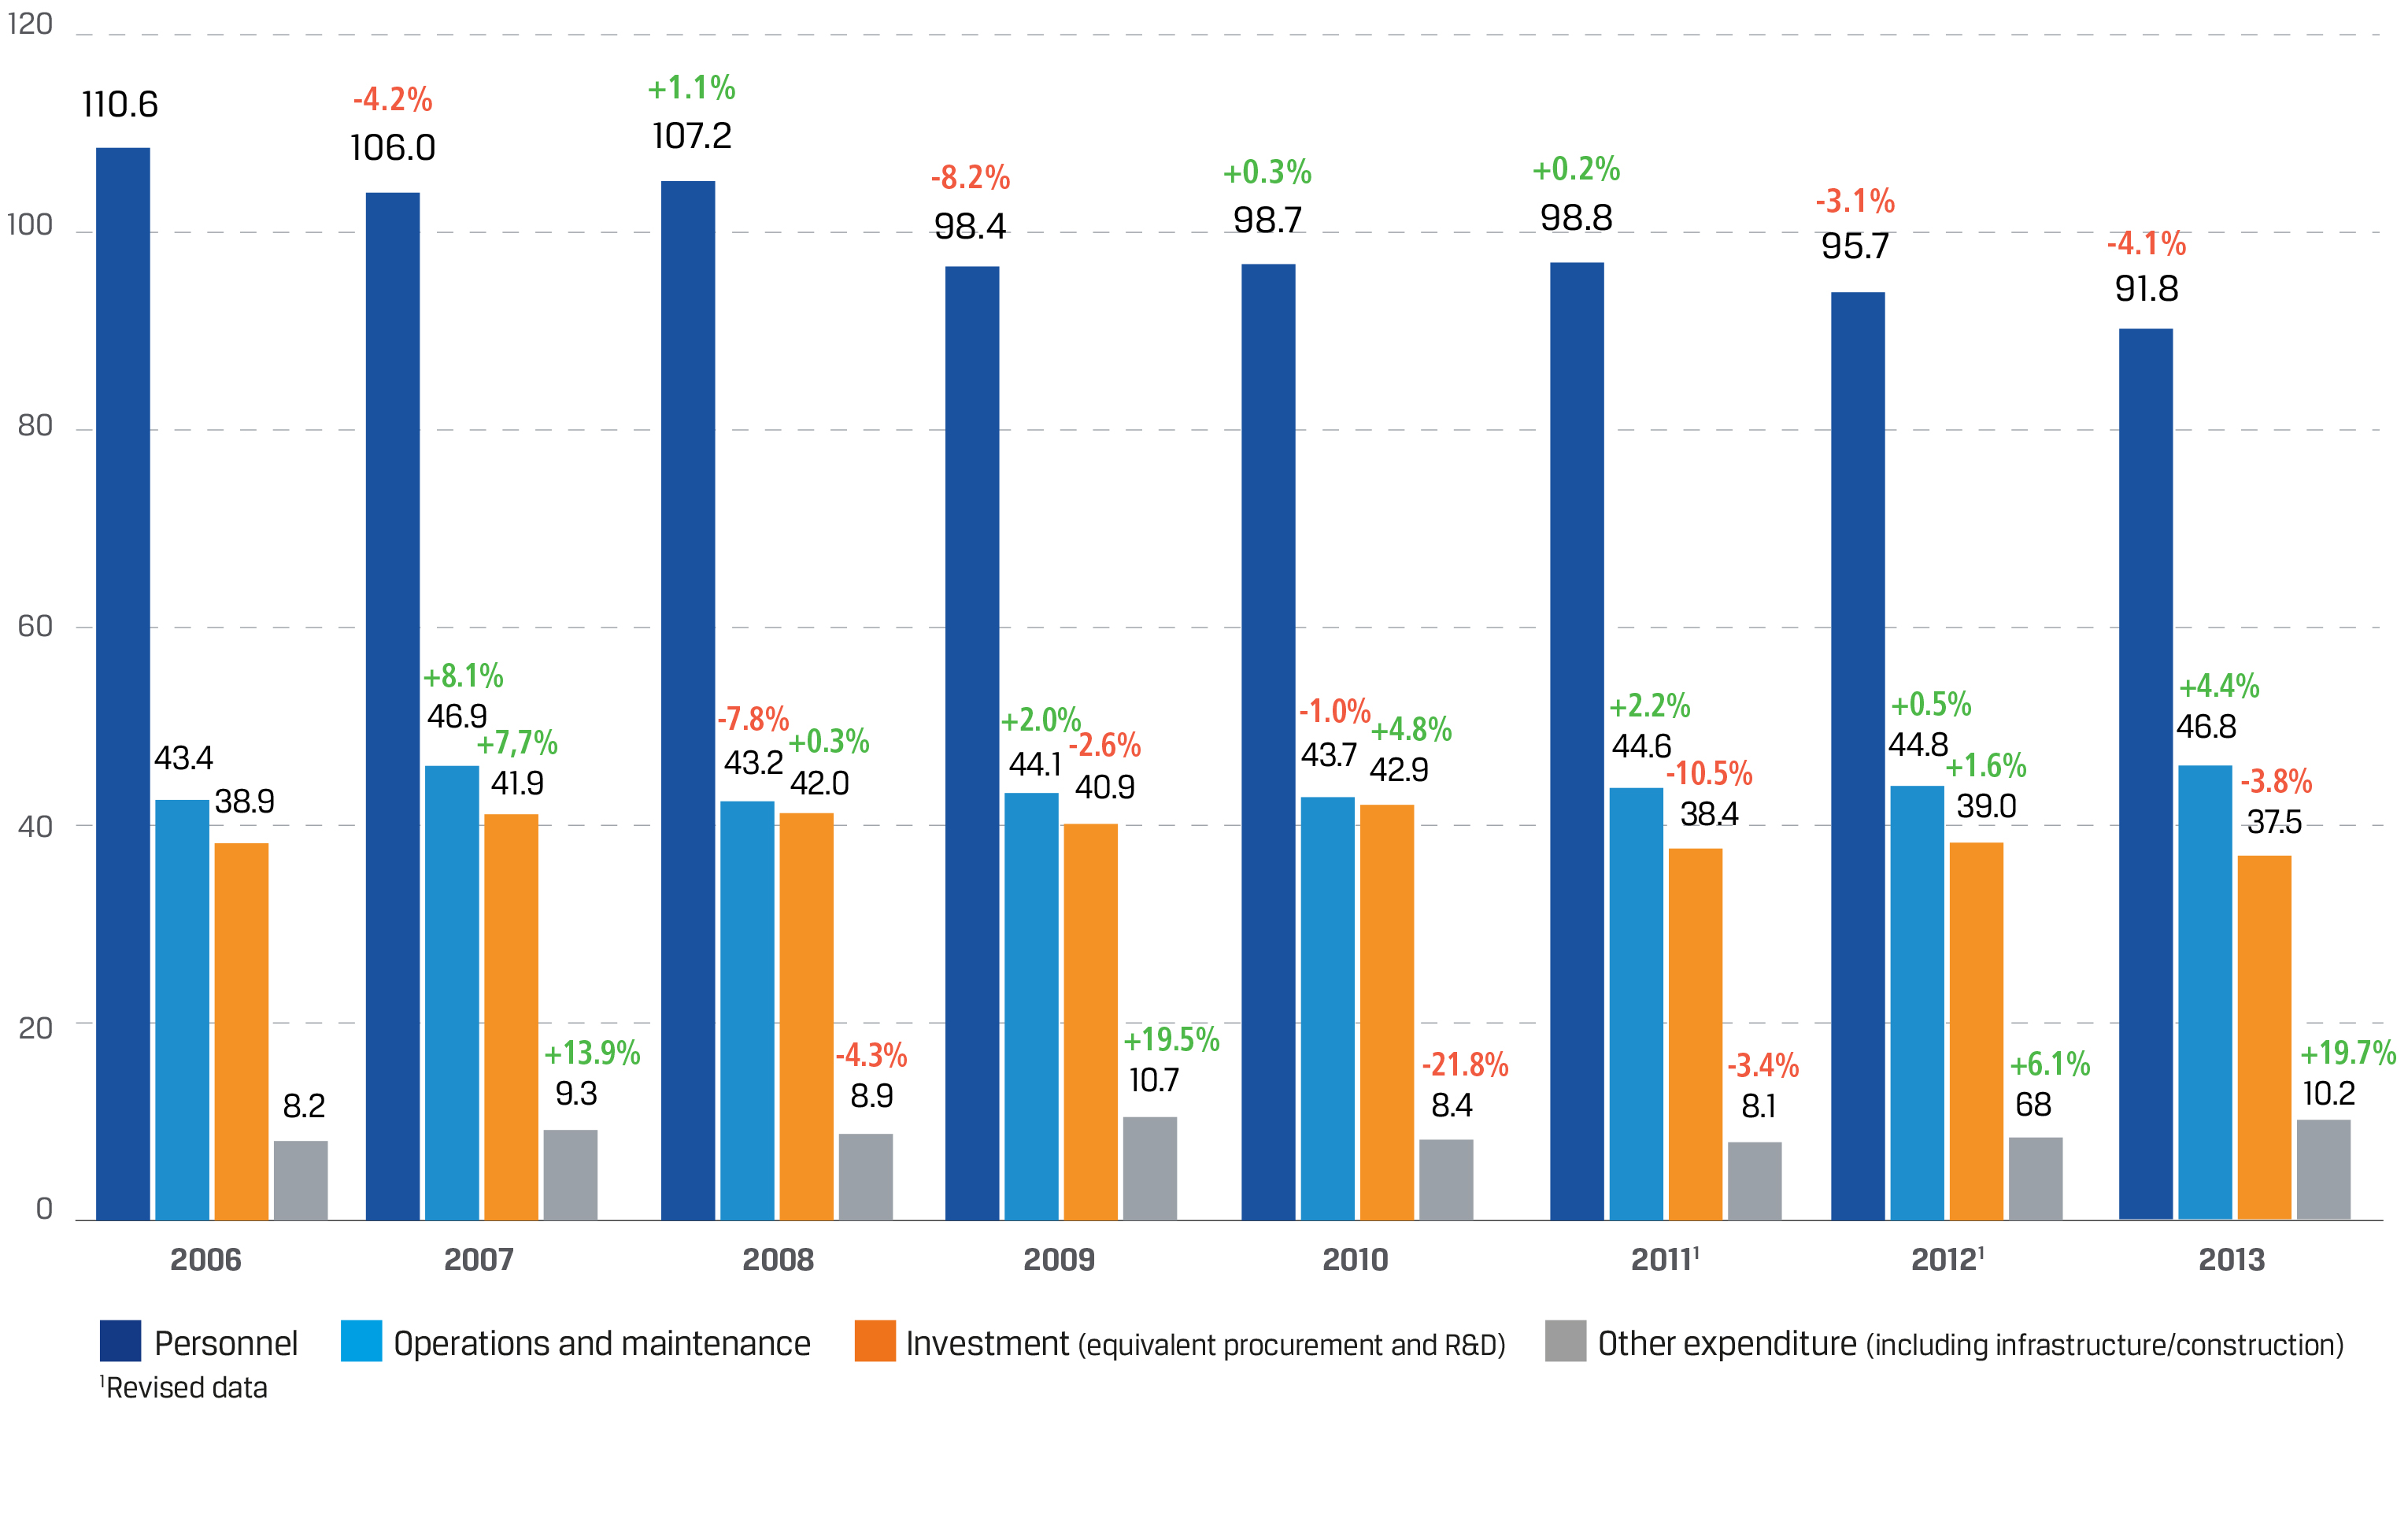
| Defence expenditure breakdown (billion EUR and % change on previous year) |
 |
Operation and maintenance and R&D/R&T expenditure increase slightly
In terms of the distribution of defence expenditure, there were some shifts in 2013. Personnel-related expenditure decreased by over 4%, from EUR 95.7 billion in 2012 to EUR 91.8 billion in 2013, and for the first time since 2006, its share in the total defence expenditure dropped below 50%, to 49.3%. Personnel expenditure expressed per person employed in defence (military and civilian) has been increasing since 2006 to reach its highest value of EUR 51,475 in 2011, and started to decrease the year after. It decreased further from 2012 to 2013 (-2.6%), to EUR 49,836.
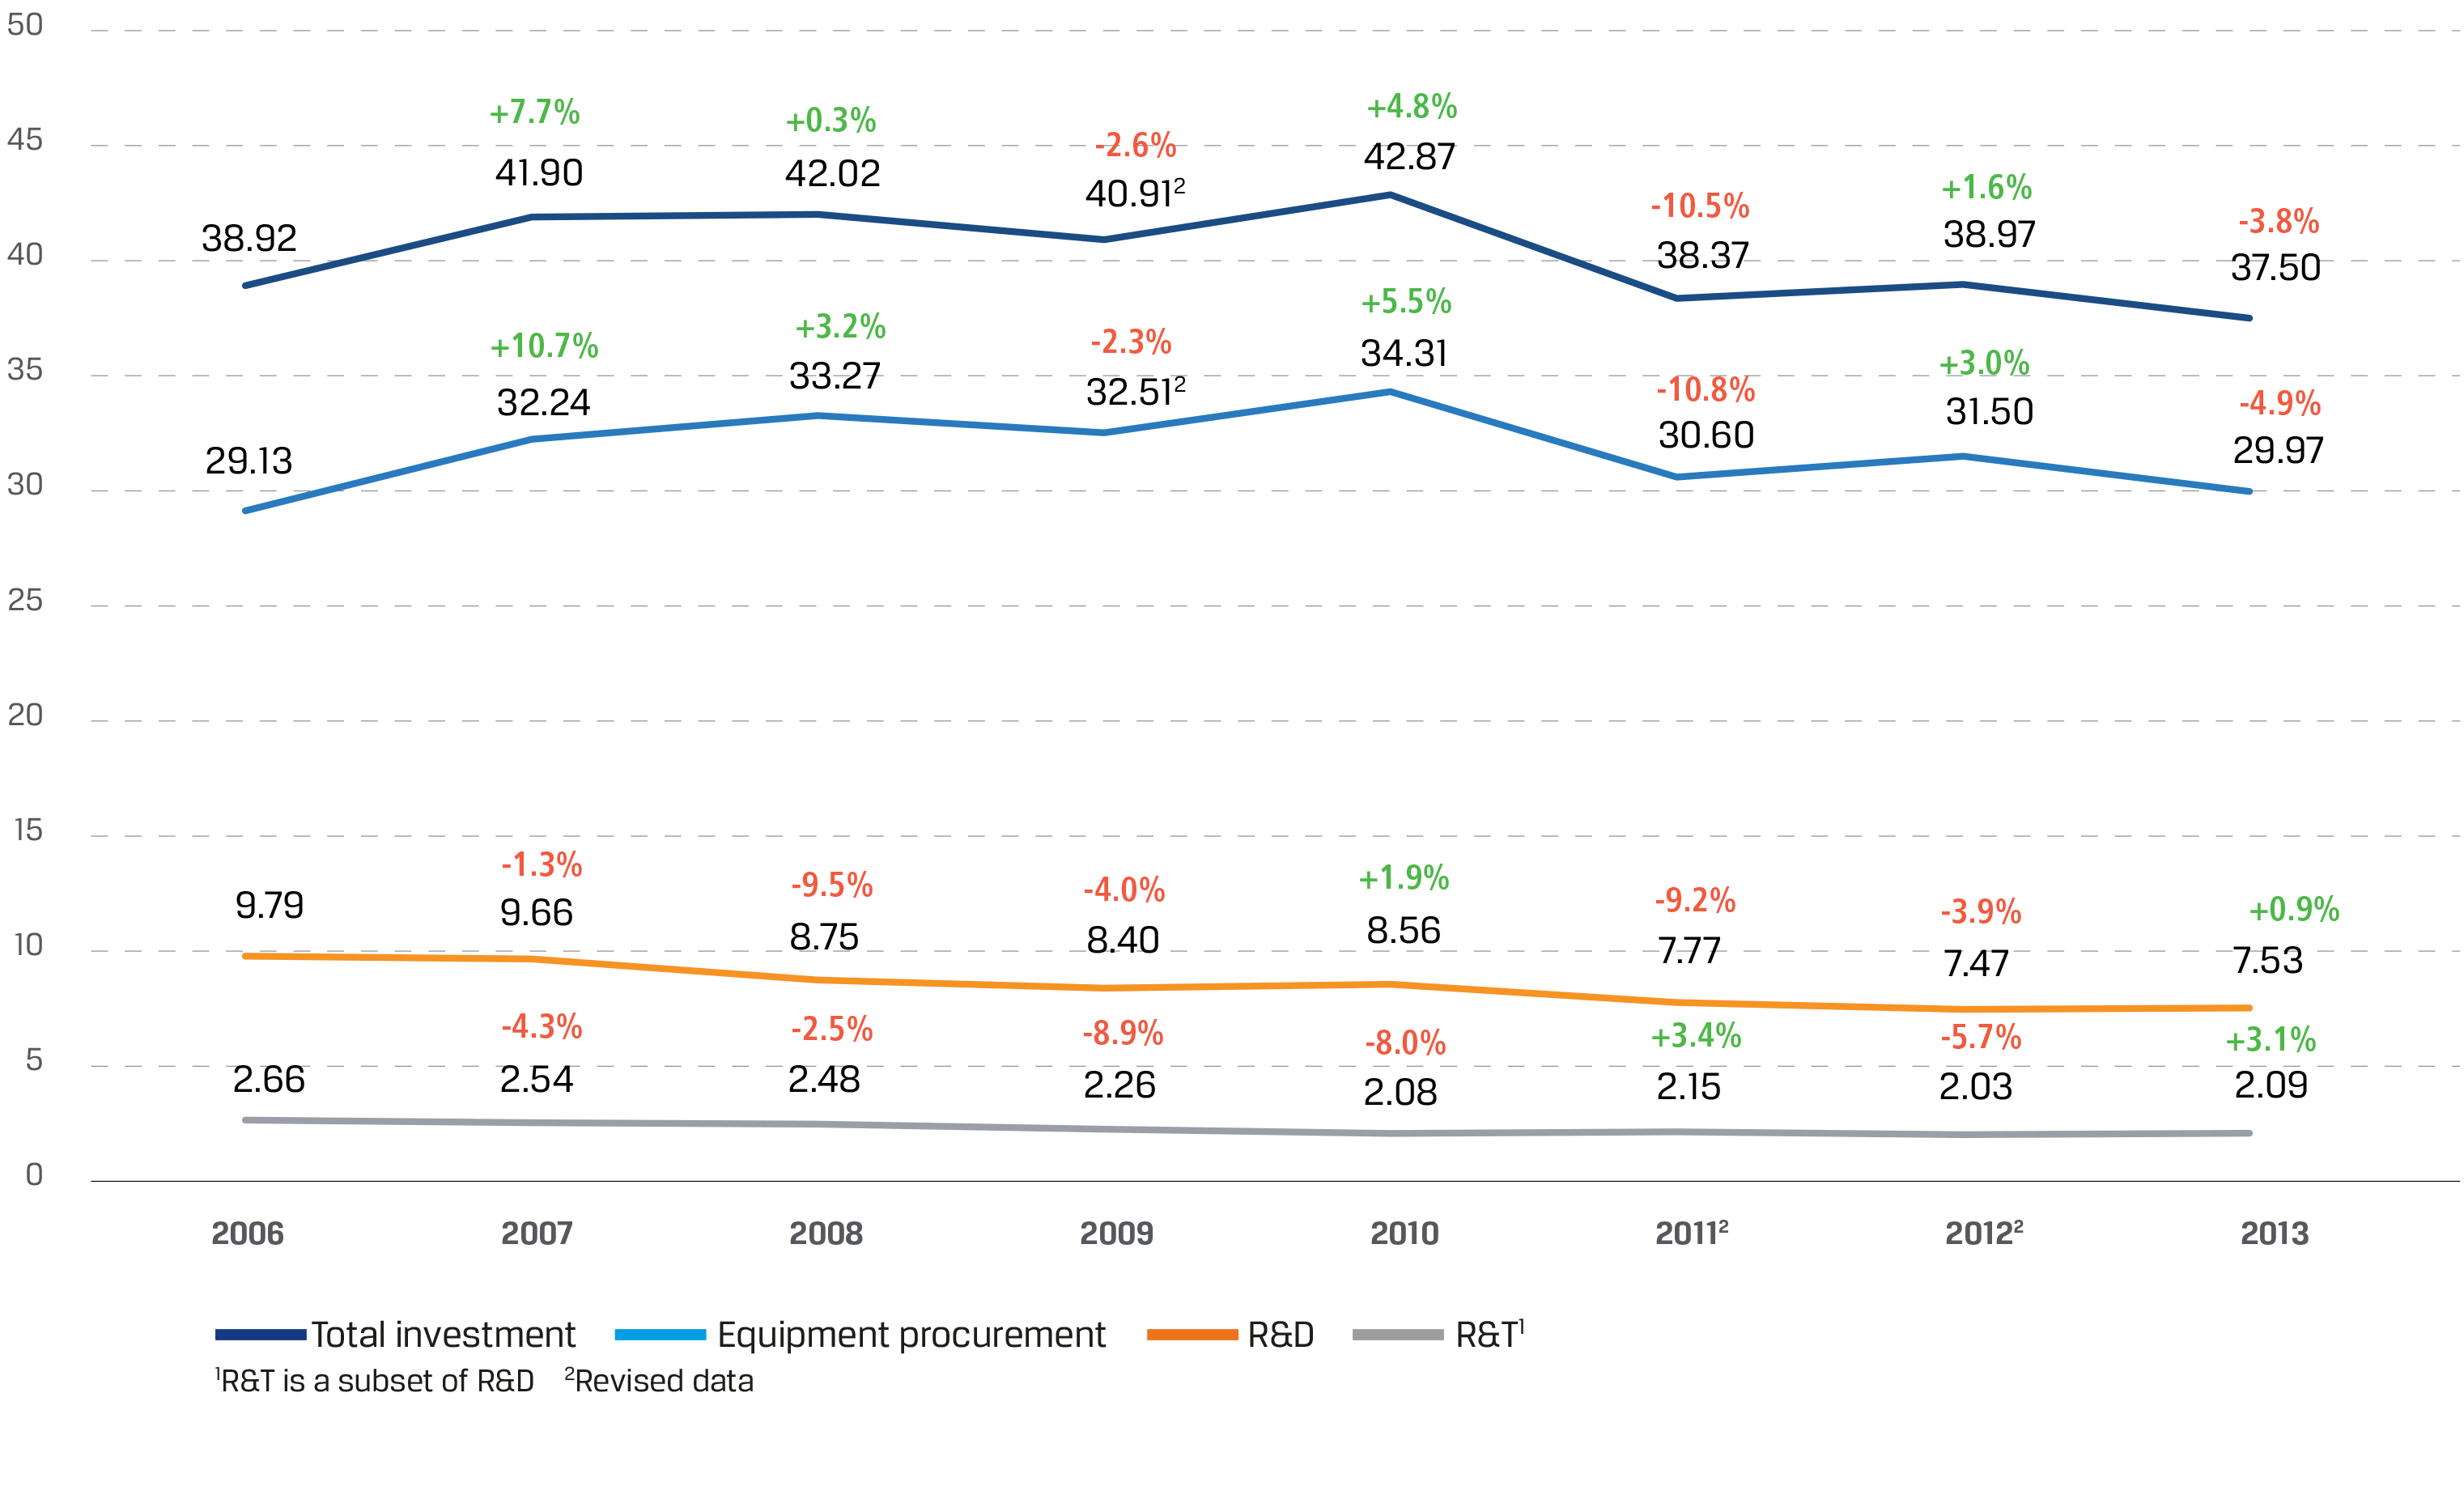
With a share of 25.1% - the biggest since 2006 - operation and maintenance expenditure remained the second largest component of the total defence spending in 2013, and, despite minor annual fluctuations, it appears to be on an upward trajectory. From 2012 to 2013, it increased by EUR 2 billion or 4.4%, to EUR 46.8 billion, and almost reached its highest level of EUR 46.9 billion recorded in 2007. By contrast, defence investment, comprising equipment procurement and R&D (including R&T) expenditure, following a sharp decrease in 2011 (-10.5%), increased slightly in 2012, but decreased again in 2013 below the level it was in 2006, to EUR 37.5 billion or 20.1% of the total defence expenditure. This resulted from a decrease in one of its components - equipment procurement - which reduced by EUR 1.5 billion or 4.9%, to EUR 30 billion (16.1% of the total expenditure).
The second component - defence R&D expenditure - increased slightly to EUR 7.5 billion (4% of the total expenditure), breaking a downward trend observed since 2006 (with the exception of 2010, when it marginally increased). R&T expenditure - a subset of R&D - followed a similar path. Being on a decline since 2006 (except 2011), it increased by just over 3% from 2012 to 2013, to reach EUR 2.1 billion. In real terms, defence investment decreased by EUR 4.8 billion or 11.3% from 2006 to 2013, whereas its components – equipment procurement and R&D - decreased by EUR 1.7 billion (-5.3%) and EUR 3.1 billion (-29.1%), respectively.
| Defence expenditure in current and constant1 prices (billion EUR) |
 |
Collaboration3: a sharp decrease in procurement and a marginal increase in R&T
Since 2012, it has not been possible to have a comprehensive picture of the total EDA Member States’ expenditure on collaborative (including European collaboration) defence equipment procurement and R&T projects or programmes, as several Member States were not able to provide this data. A glimpse into the partial 2012-2013 data reveals a worrisome trend, particularly for defence equipment procurement. Between 2012 and 2013, reported collaborative equipment procurement expenditure decreased by 20.7% to the lowest level since 2006 of EUR 4.75 billion. In relation to the total defence equipment procurement, collaborative expenditure accounted for 15.9%, suggesting that over 84% was spent nationally. European collaborative equipment procurement experienced an even sharper decrease of 21.6%, and in 2013, amounted to EUR 4.5 billion, accounting for 94.6% of the total collaborative equipment procurement.
The total collaborative defence R&T expenditure of the EDA Member States that provided the data also shrank, though less dramatically (-0.9%), to EUR 203 million. Its share in the total defence R&T was 9.7%, the remaining 90.3% being regarded as national expenditure. Although the reported European collaborative defence R&T expenditure increased by 21.4% between 2012 and 2013, with a total of EUR 168 million, accounting for 82.5% of the total collaborative defence R&T, it nevertheless remained record-low.
Defence expenditure and investment per military decrease despite reduced personnel numbers
2013 saw the seventh consecutive reduction in the number of personnel working in defence (both military and civilian), caused mainly by internal restructuring processes. The total personnel decreased by almost 600,000 or 24% between 2006 and 2013, while the number of military and civilian personnel decreased by over 500,000 (-26%) and almost 80,000 (-16%), respectively, during the same period.
In 2013, there was a total of 1,435,693 military and 407,245 civilian personnel in EDA Member States - a decrease of 0.9% and 3.6%, compared to 2012. A share of military in the total personnel has also been decreasing from the highest of 80.6% in 2008 and 2010 to the lowest of 77.4% in 2012. In 2013, it was 77.9%. For the first time since 2006, defence expenditure expressed per military decreased by 0.05%, from EUR 129,878 in 2012 to EUR 129,814 in 2013.
So did defence investment per military, which has been on an overall increasing trend since 2006 due to declining military personnel, rather than increasing Member States’ investment. In 2013, defence investment per military was EUR 26,122 - a 2.9% reduction on the 2012 figure of EUR 26,906.
Increasing numbers of troops available for deployment and actual deployments
Between 2012 and 2013, the average number of troops deployed outside the EU territory increased for the first time since 2008, both in absolute terms (+17.2%) and as a share of military personnel (from 3.4% to 4%). EDA Member States together deployed on average 58,086 troops on a continuous basis throughout 2013, which constituted 4% of the overall strength of their military personnel. In 2013, there was also an increase in the total number of deployable (land) forces (+7%) and that of sustainable (land) forces (+1.5%). The 27 EDA Member States had in total 481,001 deployable (the highest number since 2006) and 110,433 sustainable (land) forces. The ratio between sustainable and a pool of deployable (land) forces remained stable at 1:4.4.
Meanwhile, after a five-year-long upward trend, the costs related to deployed operations4 decreased for the second time in a row, both in absolute terms - from EUR 9 billion to EUR 7.4 billion (-17.1%) – and as a share of the total expenditure - from 4.8% to 4% - between 2012 and 2013. Operations costs per military deployed decreased by 29.3% and stood at EUR 127,989 in 2013.
Background
The European Defence Agency (EDA) collects defence data on an annual basis. The Ministries of Defence of the Agency’s 27 Member States (MS) provide the data. EDA acts as the custodian of the data and publishes the aggregated figures in a yearly defence data booklet.
| Defence investment breakdown (billion EUR and % change on previous year) |
 |
More information
---------------------------------
1 Data does not include Denmark which is not an EDA Member State. 2006-2012 data does not include Croatia which became the 27th EDA Member State on 1 July 2013.
2 In order to measure real growth and ensure a “real” comparison between years, inflation needs to be taken into account. Thus, data from 2006 to 2012 has been inflated to 2013 economic conditions (Source of deflator: European Commission ECFIN - based on weight of EU-28).
3 All 2012 and 2013 figures on collaboration are partial, as several Member States were not able to provide data.
4 2013 figure is an estimate, as several Member States were not able to provide accurate data, therefore sound comparisons with the previous years are limited.